Thursday, January 17, 2008
No Google Analytics API? No Problem!

Chris Riley is a web developer from the UK. In his spare time, he likes to mess about with various web APIs to create interesting and useful mashups.
If you’re like me, you probably have a blog and use Google Analytics to track visitor activity. If you’ve not already got one, you probably want a “Most Popular Posts” section on your blog as it’s a great way for new visitors to find your best content. The only problem is that this would usually have to be hard coded, and would therefore need updating periodically after you’ve checked the “Top Content” report in Google Analytics, or it would require some server-side scripting and a database to track your page views and show the links dynamically.
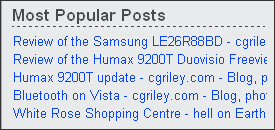 Wouldn’t it be great if you could somehow use Google Analytics to display the “Most Popular Posts” section on your blog automatically? That would be a huge time-saver for you and would make it much more useful for your visitors as it would always be up-to-date. Unfortunately, Google Analytics doesn’t have an API, but here’s a method that doesn’t involve any server-side code or screen-scraping. All you need to do is use a few existing free services from Google and Yahoo and a bit of JavaScript.
Basic Method
- Obtain the tracking data in a usable format – We can schedule Google Analytics to email this as an XML file on a regular basis.
- Make the XML file accessible online – By emailing an attachment to Google Groups, the file is automatically given a public URL.
- Work out the URL of the most recent report – Since Google Groups provides RSS/Atom feeds for all messages, we can easily find the URL of the most recent message and therefore work out the URL of the XML report.
- Prepare the data for use – We need to manipulate the XML and massage it into a handy JSON format that we can use on our blog, which can all be done using Yahoo Pipes.
- Display the links on your site – With just a bit of client-side JavaScript, you can finally add a self-updating “Most Popular Posts” section to your blog.
There you have it! Using your own Google Analytics data, you can create a completely automated way of displaying your most popular posts to your site visitors.
If you’re interested in exactly how I did this, the rest of this post expands on each step and take you through the entire process...
Setting up the Google Group
Since Google Analytics doesn’t provide an API, or allow you to link directly to any exported reports, we’ll use a Google Group to host the files which we’ll schedule Google Analytics to email to us. When you setup your Google Group, choose the Announcement-only option. Once created, under the Group settings menu item, select Access and make sure that Anybody can view group content, Do not list this group and People have to be invited are all selected. This is so that no one else can post to the group, which would cause issues when trying to retrieve the Analytics message. Keeping the group unlisted makes it less likely for someone to stumble across your Analytics reports when searching Google Groups. Although it would be preferential to make the group private, this would prevent public access to the feeds for the group, which we’ll need later.
While we could email our reports directly to the Google Groups email address, each message would then contain an “opt-out” link because it’s not the email address we’ve got registered with Google Analytics. Given that our messages will be publicly available, we’ll be using Gmail to forward the messages from the same Gmail address we use for Google Accounts so that if anyone manages to find the Google Group, they can’t stop our scheduled report. Simply create a new filter, looking for any email with Analytics in the subject that has attachments and have Gmail forward the email to your Google Group. (You can choose to “skip the inbox” so you don’t have automated reports cluttering up your inbox too.)
Setting up Google Analytics
In Google Analytics, under the Content section, view the Top Content report and change Show rows from 10 to 50. (You can’t configure how many results to include in your report any other way; it just remembers the last setting you selected.) Now click the Email link button near the top of the page, beneath the page title. Select the Schedule tab, change the report format to XML, set the date range/schedule to Monthly (unless you have a really active blog, then you might want to keep it on Weekly) and click the Schedule button at the bottom. Just to test everything, select the Send Now tab, choose XML as the format and click the Send button.
If everything worked correctly, after a few seconds your Google Group should have a Top Content XML report in it! :o)
Yahoo Pipes
You’ll need to find the feed URL for your Google Group. You can get this from the XML button at the bottom of your group homepage. Choose one of the New messages feeds, copy the URL and head on over to Yahoo Pipes...
For those that don’t know, Pipes is a really powerful service provided by Yahoo that lets you fetch data from all over the web and perform various operations on it, resulting in new or altered XML feeds / JSON output being created, all done using a funky graphical interface – not a line of programming code in sight!
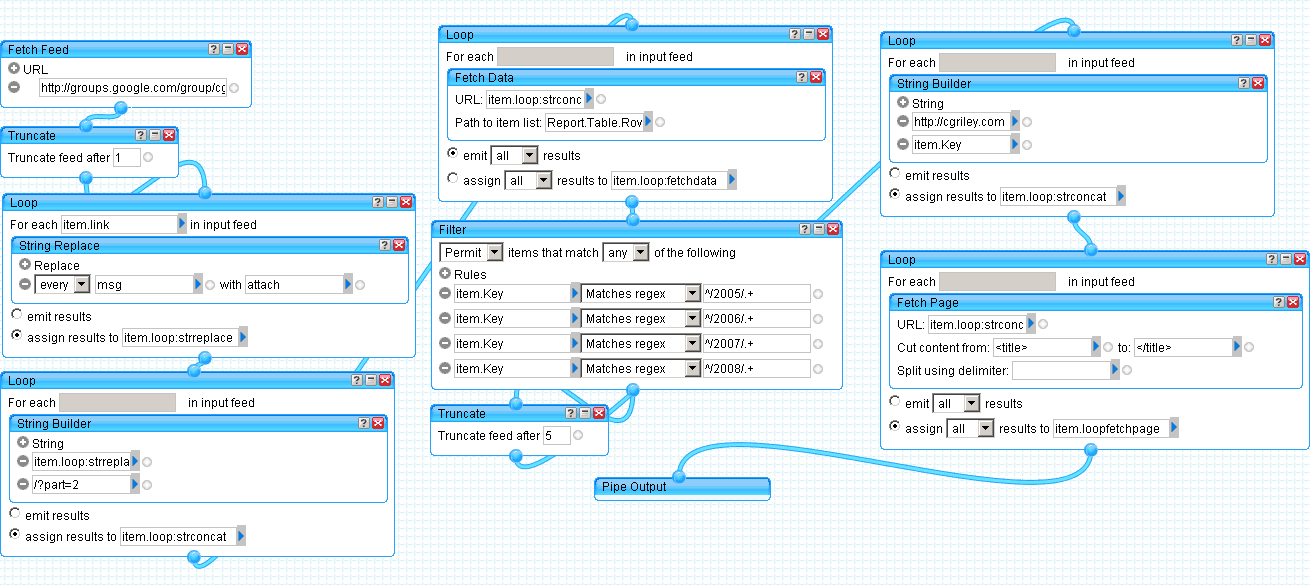
A screenshot of the Pipe being used.
The Yahoo Pipe I’m using can be found here. If you’re familiar with Yahoo Pipes, feel free to view the source, clone this pipe and use it as the basis for you own implementation. For those not familiar with Yahoo Pipes, here’s a brief rundown of what’s happening:
- Grab the Google Groups XML feed and truncate it to leave us with the most recent message.
- Take the message URL and modify it to give us the URL of the XML attachment (basically replaces “msg” with “attach” and appends “?part=2”).
- Select the report data from the XML attachment and filter out any links we don’t want to include.
- Finally, using the filtered links, fetch each blog post from the website to retrieve the page title for use in the link and truncate the results to return only the top five.
The result is a JSON file containing the top five most popular blog posts based on the most recent Top Content report sent from Google Analytics to the Google Group.
Displaying your “Most Popular Posts”
The final step is to take the JSON file returned by Yahoo Pipes and display the contents on you website, which can be done using some client-side JavaScript similar to this:
(Basically, we’re making the pipe execute a JavaScript function on the web page by using a callback on the JSON URL. To learn more about JSON visit the Yahoo Developer Network’s JSON overview, or the official home of JSON, JSON.org.)
Conclusion
This is a simple way of making your Google Analytics data available to use in your own web pages and applications. There are obviously some privacy issues, as your report data is available for everyone to see on Google Groups (which can easily be found by doing a quick search) but if you think that’s a worthwhile trade-off for being able to have a maintenance-free top posts section, then the world is your oyster...
And you’re not just restricted to displaying your most popular posts. You could also use a similar technique to display your top keywords, referring sites, geographic locations, browsers... and anything else which you can find in Google Analytics!
Have fun mashing up your Google Analytics data!
>> More posts
Advertisement
This site unofficially covers Google™ and more with some rights reserved. Join our forum!