Wednesday, April 18, 2007
Google Spreadsheets Adds Charts
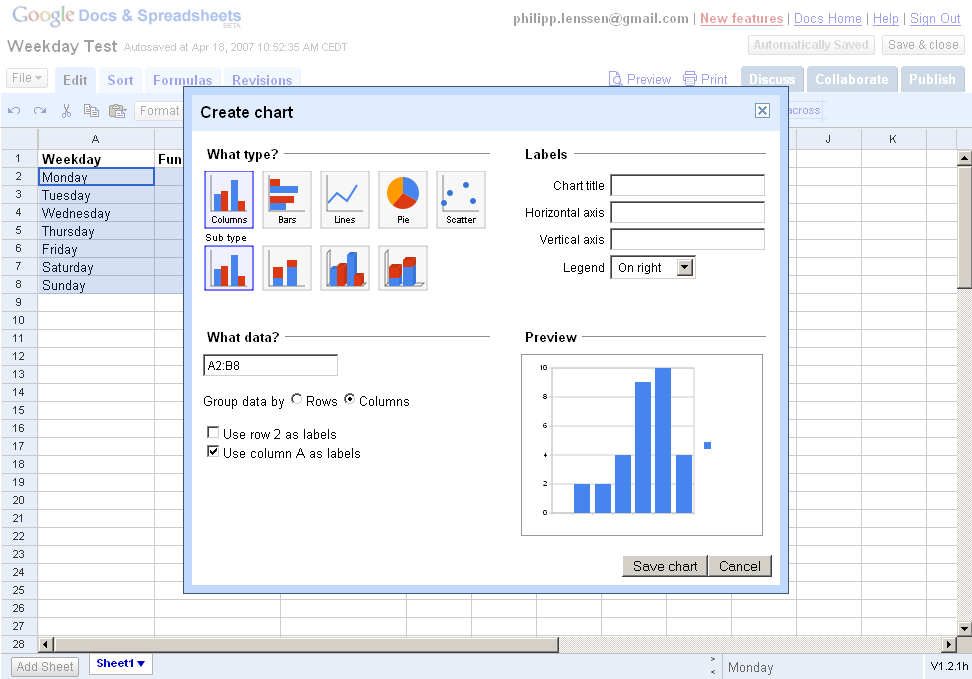
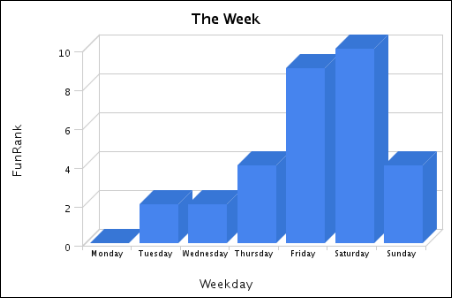
Cool – Google Spreadsheets now supports charts! Just select the cells you need and hit the chart button  at the top. The tool is quite intuitive – charts are divided into types (columns, bars, lines, pie, and scatter) and sub-types (like a 3D effect) – and it’s a bit easier to use than Microsoft Excel’s chart feature. Later on, you can export the chart as PNG, like the one below, or publish your spreadsheet & chart onto a webpage (as usual).
This must have been one of the most anticipated Google office features, and it’s a reason less to use or buy Excel.
[Hat tip to Daniel Garcia, Reto Meier, Inferno and Official Google Docs blog!]
>> More posts
Advertisement
This site unofficially covers Google™ and more with some rights reserved. Join our forum!