Monday, May 28, 2007
10 Cool Things You Can Do With (the New) Google Analytics
| Eric Enge of Stone Temple Consulting has worked in the tech industry for two decades. He also works with Moving Traffic, the publisher of City Town Info and Custom Search Guide. |

|
The new release of web traffic tracker Google Analytics is out. As I recently wrote in my Search Engine Watch article Digging Deeper Into the Latest Release of Google Analytics, this release marks a strong positive step forward for Google Analytics. GA also performed well in my recent web analytics comparison report, where I had 7 analytics vendors running simultaneously across 4 web sites.
In this article, I plan to look at 10 cool things you can do with the new Google analytics. Here they are:
1. Email out your reports
Emailing out your reports is such a cool feature, and one that was sorely lacking from the prior version of GA. Each report screen has an Email icon up on the top left. Click on the icon, and then on the Schedule tab, and you get this setup screen:
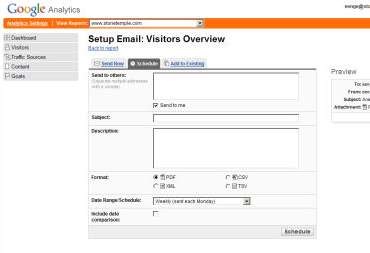
You can set who you want the report sent to, and how often you want it sent (daily, weekly, monthly, or quarterly). This is a great tool to use when you are dealing with a boss or senior manager who wants information on a regular basis. Send them what they want automatically.
2. A/B Testing
I recently spoke to analytics industry luminary, Eric Peterson, and he said: “If you are not doing controlled experimentation, you are not doing web analytics.” In fact, A/B testing and other forms of controlled experimentation can bring huge gains to your ROI. This can take many forms, but here are three of the most common ones:
- Trying out different ad copy in your PPC ads. The key here is to tag each version of your URL with a different tracking parameter.
- Test different types of landing pages.
- Try out different offers.
3. Geo overlays
Use the Geo Overlay feature to see where your traffic is coming from. If you click on the Visitors menu on the left, one of the expanded choices is Map Overlay. This allows you to quickly see where your traffic is coming from. Here is what it looks like:
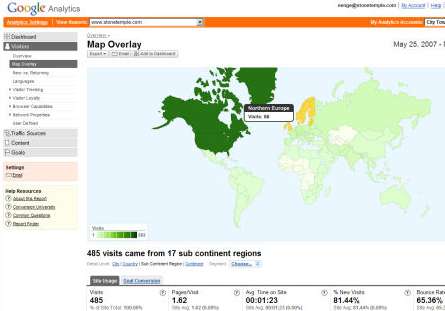
In this example, I have set the view to Sub Continent Region. But I can also set it to Continent, Country, or City, to get the data at whichever level I prefer. This is very, very useful if you have a business tied to a particular geography. I have used this feature to help a client detect problems in the targeting of an AdWords campaign.
In AdWords, you can geo target your ads. In the U.S., this can be filtered down to a city and state level, or even within a specific number of miles from a location you specify. Want to see where your AdWords traffic (only) is coming from? Go to Analytics Settings and apply a filter to your profile, to filter only on the people coming in from AdWords (use a tracking parameter on the URL in your AdWords ad to make it easy to setup a filter to do this).
For more information on setting up filters, check out my recent article in Search Engine Watch titled: Using Google Analytics to Manage Content Groups.
4. Finding new referrers
Use the referring sites list to discover new inbound links. Simple and easy. Go to the Referring Sites report (first click on Traffic Sources on the menu on the left side of the screen). Then set your date range to look at yesterday only. This is easy, just click on the gray down arrow to the left of the dates. Now, at the bottom of the referrers report, click on the “Show Rows” drop down, and expand it to 100. If you have more than 100 referrers per day, you can use the arrows to the right of the Show Rows drop down to scroll through pages of referrers.
Now scan the list of referrers for new referrers you haven’t seen before. Better still, if you are a programmer, export this list into a CSV or TSV file (see top left of the screen for Export options) on a daily basis, and then keep a file that cumulatively identifies all your referrers. Once you have a data file that lists all your historical referrerrs, now you can take your daily export of the daily referrers, and compare it to your historical referrers data file, and see first time referrers.
You then update the historical referrers data file, and also output to your screen and/or a separate file, a first time referrers list. Now you have uncovered your new links from yesterday. Note part of what makes this work is that most people click on out bound links that they implement to see if they work.
5. Drilling down referrers
Drilling down and finding all the referring traffic data from one site is a really cool for a variety of reasons. For one thing, you can track your traffic from a social media site in detail. Here is an example using StumbleUpon:
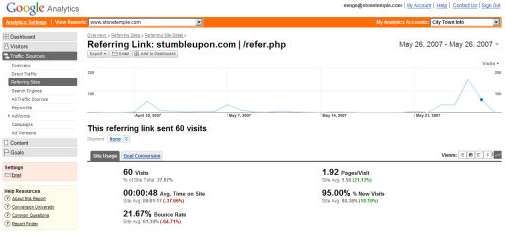
As you can see, we have 3 peaks in the data, and these peaks relate to the days I published 3 specific items of content, the first being an interview with Adam Lasnik, the second being the web analytics report already referenced above, and the third being a post about 17 Poor Quality Signals Your Site May Be Sending.
The cool thing about this is that you can quickly get a strong feeling for what content a particular audience likes best. Mapping your content performance across social media / social news sites is a good way to learn how to better map your social media campaigns.
6. Navigation summaries for individual pages
Use a navigation summary to look at each page on your site, and see where people came from, and where people went to from your page. You can find this report by clicking on Content in the menu on the left, and then Navigation Summary under the Navigation Analysis section on the right. Here is a sample of the report:
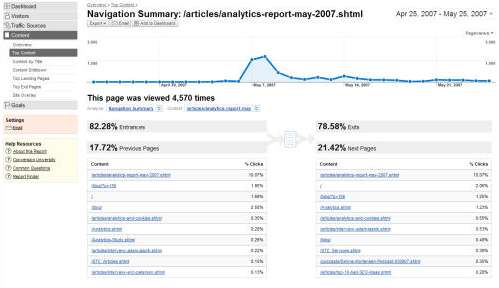
As you can see, the report was published on May 7th, 2007, and had an immediate spike upward in traffic, and then the traffic level sloped off over time. Notice the detailed tables below the graph. 82.28% of people entered the site at this report, and 78.58% of people left the site from this report. Other than that, you can look at the details of where users came from when they read this report, and where they went to.
This is really useful when you want to check out traffic flow in and around key pages on your site.
7. Break down your inbound traffic
Want to break down your inbound traffic to a page really quickly? Use the Entrance Sources Report. You can find this report by clicking on Content in the menu on the left, and then Entrance Sources under the Landing Page Optimization section on the right. Here is a sample screen shot:
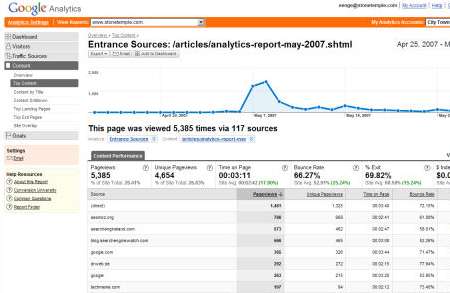
You get a great fast view as to what referrers bring the most traffic. This page had a bit of a surprise for me. Our analytics report got prominent mention in Search Engine Watch, Search Engine Land, and SEOmoz. Which one brought us the most traffic? SEOmoz. I would bet that no one would have guessed that.
Note that this probably relates to how the particular audience of one site relates to the particular content published. But, as with social media sites, getting insights into the nature of various audiences is a great thing to do.
8. Entrance keyword analysis
Next up on our hit parade is the entrance keywords analysis. You can find this report by clicking on Content in the menu on the left, and then Entrance Keywords under the Landing Page Optimization section on the right. Here is a quick fast view of the keywords that drove traffic to a particular page:
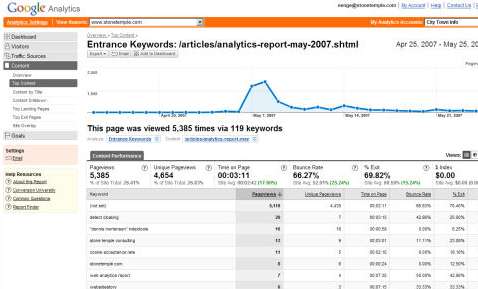
This is cool, because you can see keywords on a page by page level. One thing that struck me on this page was that our analytics report was getting search engine traffic on the search term “stone temple consulting”. So I tried the search at Google, and sure enough I found that we had two listings come up for that search term, and the second, indented, listing was to our analytics report.
You can find various types of problems this way. For example, the report shows that 20 people came to the analytics report page after entering in the term “detect cloaking”, a completely unrelated term. I am still working on why that might be the case!
9. Site goals
Setup goals for your site. What are you trying to accomplish with a user? Even if all you are trying to do is to get someone to fill out a Contact us form, set it up as a goal and track it. To setup a goal, click on the “Analytics Settings” menu item on the far left of the orange nav bar on your screen. Once you have done this, you will get a screen that looks like this:
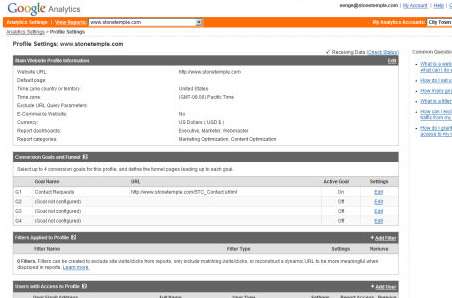
The configuration of the goal is generally pretty easy. Now, many of your reports will begin to show what actions are leading people to convert.
10. Goals for Ecommerce sites
Simple goals don’t work for you because you have an Ecommerce site? Google Analytics now offers a rich array of information that allows you to drill down into what is happening with your e-commerce. With a little bit of configuration and setup, you can get several different views of your Ecommerce performance, including:
- Revenue by Source
- Revenue by Product Category
- Revenue by Product
- Conversion Rate Mapped out by Day
- Average Order Value by Day
- A Detailed look at the Revenue From Each Individual Transaction
- A Break Out of how many Visits Users Make Before Purchasing
- A similar Chart Showing The Time Between a User’s First Visit and their Making a Purchase
If you have an Ecommerce site, there is a lot you can do here to see what is really happening with your transactions.
There will be those who outgrow the capabilities of GA, and move onto other packages. But, there is a lot of new functionality in Google Analytics, and it can be a very effective tool for site owners to use to grow their business.
>> More posts
Advertisement
This site unofficially covers Google™ and more with some rights reserved. Join our forum!
