Tuesday, February 12, 2008
AdWords Charts Generator
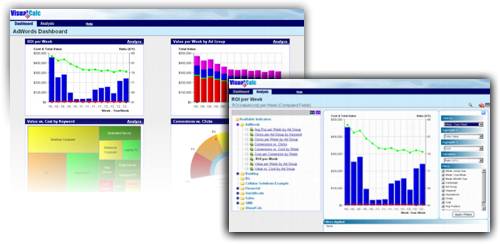
The VisualCalc AdWords Dashboard aims to help you sort through the data generated by Google AdWords ad campaigns. The makers say their service “turns your raw AdWords/PPC data into graphical performance indicators, such as clicks vs. impressions, conversions by ad group, click through rate by keyword, etc.” Note the graphs of the sample application, as shown in the screenshot, are all Java-based. [Thanks Bob Bennett!]
>> More posts
Advertisement
Advertisement
This site unofficially covers Google™ and more with some rights reserved. Join our forum!

