Friday, March 21, 2008
Google Analytics Benchmarking Live
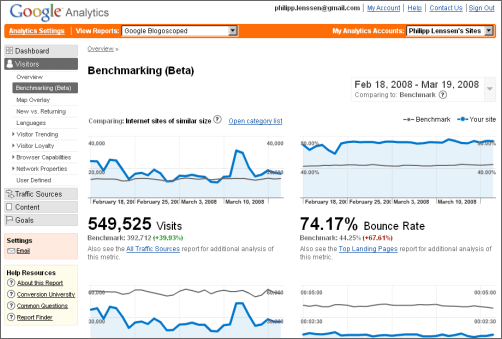
Google’s new benchmarking section is live now in Google Analytics. If you opted in to the servive, you will find it in your site stats navigation at Visitors -> Benchmarking. You will then see a number of charts from sites of comparable traffic, so that you can find out if e.g. your visitors stay longer on pages than average, or if they visit more pages than average. Your own site’s traffic will be displayed in the usual blue, whereas the traffic of all the other comparable sites is displayed with a gray line. (Note that the invidiual charts graphics use sub titles, not headlines; this is formatted so it can be misunderstood.)
Also, a category list on top offers items like Entertainment/ Music or Society/ Education which you can pick from to restrict the charts to compare to sites within that category only.
All in all I think the data is interesting to take a look at once, but personally I find it hard to imagine how to utilize these numbers on a more regular basis. If you have a site you probably want to grow the traffic anyway and not spend too much time comparing to sites of a similar traffic size – rather, for inspiration you would be more interested in what sites in your niche with a much higher traffic might do differently. And comparing data like “average time on site” by just picking a broad category, such as “Games”, seems too unspecific to gain good understanding of differences to other sites which would really matter (is it a Flash-based games site? Is it a single game or a collection? Is it for kids? Games for adults? A poker site? A game download site? and so on. What good would it do for me to know that people spend longer on my web-based games site than say a site which merely offers a PC game for download?). What do you all think?
[Via the official Google Analytics blog.]
>> More posts
Advertisement
This site unofficially covers Google™ and more with some rights reserved. Join our forum!