Tuesday, July 24, 2007
Peak Points, a Google Analytics Suggestion
Tokyo-based usability consultant Yongfook suggests a new feature to Google Analytics: Peak Points. He writes:
Peak Points would manifest itself as simple labels that appear automagically on your Dashboard line graph. At any proportional increase in traffic, over what Google Analytics calculates as “normal” (or a user-set value) Google Analytics would attach a label at that point. Google Analytics would assign each label a type, based on why it thinks traffic has increased proportionally since the last point.
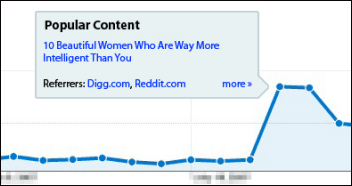
Yongfook divides the peak point source into three potential candidates, which would show when you click on the peak point label (see the “expanded” version of this above):
- “Popular content” would be when you create a page on your server, like an interesting blog post, which would suddenly be linked from a lot of sites (of course, “suddenly” and “a lot” are hard to define, but not impossible using relative thresholds working on your average site traffic).
- “Top Referrer” is when a high percentage of traffic comes from a single referrer.
- And “Discussion” indicates that there is a high amount of recurring traffic (same IP/ cookie, I guess) to the same page, indicating that people want to follow a discussion of something, or are waiting for an update.
Naturally, implementing such peak points offers a risk as well; Google could get it wrong some of the time (the peak source is a guess, after all) which would end up in more noise. But there’s also a high reward: a peak point in traffic is often the moment when you as webmaster need to act fast. Recently, Google Blogoscoped was very slow, for instance, but Google Analytics doesn’t provide me with a simple explanation for this; instead, I need to a) wait until Google Analytics catches up with the data, which due to their delay may mean I miss crucial hours to act, and b) I then need to go through all of my sites which have been added to Google Analytics (and share the server with this blog) to look for where the peak happened.
After having found the peaked site, you can check the top referrers and get involved in the discussion on the referring site, or disable a script, or provide a special “welcome” message (or “sorry” message, if the site is too slow). You can then also try to squeeze more performance out of a potential bottleneck script, or order a new server if that optimization already happened. (In the case of the recent Google Blogoscoped lag, it turned out the cause was I-Am-Bored.com linking to GamesForTheBrain.com, and the result was a “welcome” message, listening to the I-Am-Bored user feedback, the temporarily removal of some database-heavy games, as well as finally ordering a new server for that site.)
Google Analytics already went from a straight copy of the very unusable Urchin in the beginning to an overhauled interface with excellent usability these days. Wouldn’t it be interesting if the team behind this would now crack their heads on how to revolutionize web statistics – to rethink this application, like Google rethought email clients with Gmail? There seem to be so many ways to do more with the data, like Yongfook suggests.
I’m curious – what kind of advanced/ more abstract analysis would you like to see in web stats tools like Google Analytics?
[Via Digg search. Image by Yongfook.]
>> More posts
Advertisement
This site unofficially covers Google™ and more with some rights reserved. Join our forum!